
The Power Tier List
Summary: A Hypothetical question that I asked myself during the pandemic, which I decided to find the answer to. A whopping 584 characters were ranked.
Role: Systems Designer/Creator
Project: Personal (1 Person)
Development time: August 2020-March 2021
Made Using: Google Spreadsheets

A Hypothetical question that I asked myself during the pandemic which I decided to find the answer to. A whopping 584 characters were ranked.

Lessons Learned:
Simplifying Data Systems: Some statistical systems involve complex variables; simplifying them not only helps with understanding but also speeds up the production process.
Creating Reference Variables: Systems with a wide variety of variables can quickly go into disarray if they lack a strong reference variable.
Data Analysis: Examining trends and all the various entries on a macro level can reveal imbalances in the game or even opportunities your players are creating that can be capitalized on!
Origins and Collecting Data

There was already a major stumbling block to this hypothesis: whether I should collect information and data on characters from non-video games.
One of the most popular crossover games of all time, Marvel vs Capcom, is built on the premise of video game characters vs. non-video game characters. I originally had planned to include non-video game characters, but soon found that trying to do so was a fool’s errand.
Characters from franchises such as Marvel or Dragon Ball fluctuate so often that it would prove too difficult and beyond the scope of this personal project.
I did, however, include several indie crossovers and fan games as well as some fighting game-like games to make my list more thorough in its analysis of video game characters. For example, I included a game called Super Smash Crusade since it included Crash Bandicoot, a highly popular character that has not appeared in any crossover fighting games.

After deciding on my data scope, I began working on how to categorize the characters exactly.
Power scaling has always been a somewhat popular activity among various fandoms, to the point that there is a dedicated hub for it titled VsBattlesWiki.
However, I personally disagree with how they rank, as they use a comparative scale that also incorporates gameplay. For example, in the wiki, multiple characters from the Tekken franchise are considered superhuman because they can, within the gameplay, survive a hit from the character Kazuya Mishima.
However, if you look at the context of the game’s universe and story. One will realize that, at least within the game’s own story, this logic is not supported.
On top of this, Powerscaling often becomes entrenched in its own terminology, making it too difficult for the common layman to parse.
I wanted to create a system that not only felt more accurate to a game's narrative but was also simple for the average person to understand. Thus, the 3T system was created.
Creating the Power Scaling System.

The 3T system was meant to factor a character’s own individual traits as seen in their home series. This system doesn’t account for crossover media or hypothetical power comparisons, as it aims to reflect a character’s current canonical strength. The only comparisons are those done directly in the series itself, such as when a character defeats a strong enemy in a boss fight.
I would then research the character, read their backstory, watch and read plot summaries, and consult friends who knew the franchise. and then would write down their statistics into the system.
As seen in the previous picture, the statistics are divided into 10 categories. These 10 categories were meant to cover all possible comparison statistics for two characters.
Depending on how well the character is in the canon of their story at that particular statistic, they would then be assigned a number seen above in that category.
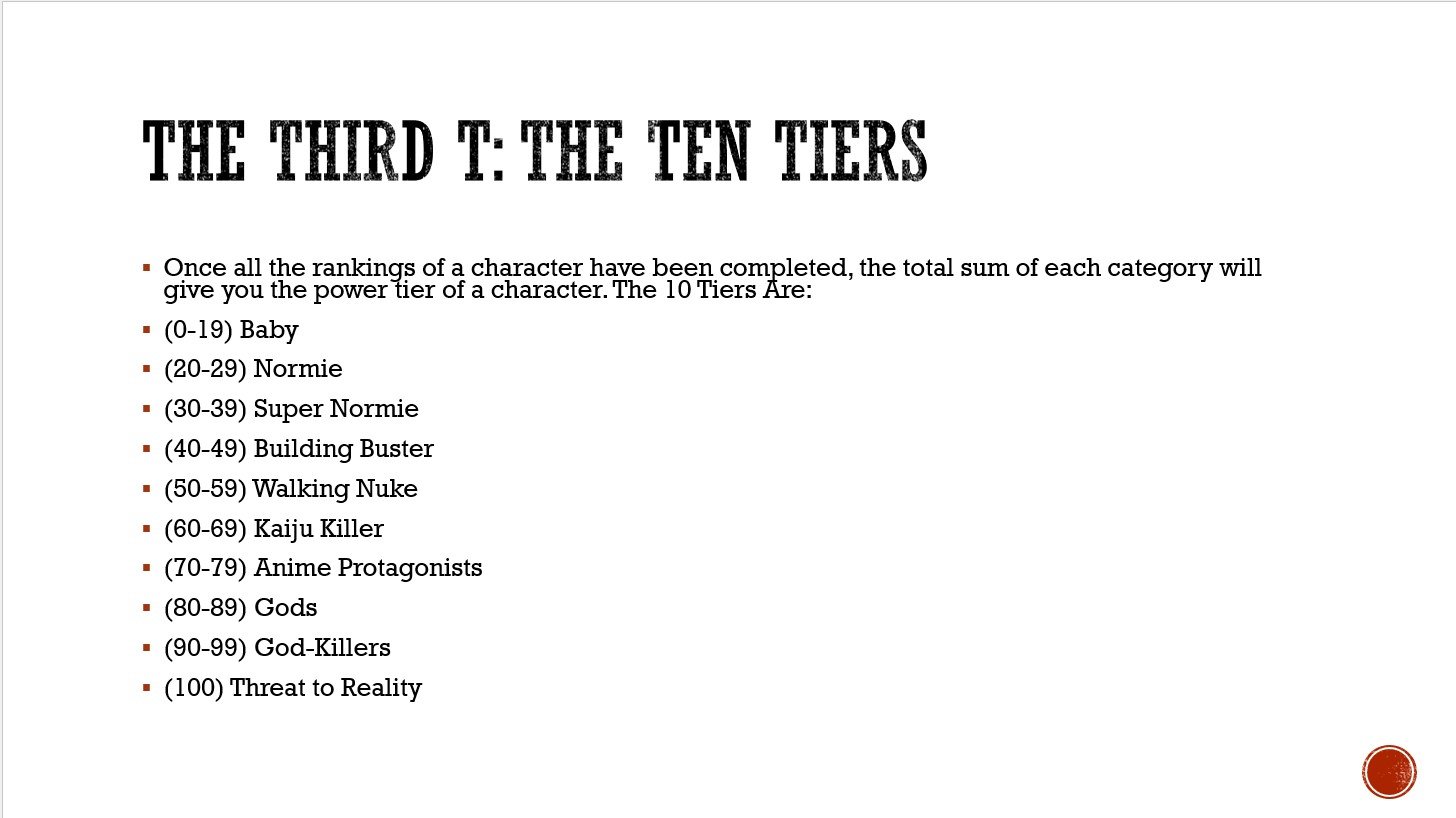
Once a character has completed all its rankings, its numbers are summed. Depending on how high that total sum is, the character is then placed in a certain “Tier” of strength.
These tiers operate almost like weight classes for canon power or, for those more fighting game inclined, matchups.
For example, a character with a power ranking of 50-59 lands in the “Walking Nuke” Tier. They can fight anyone ranked above them and have a 50/50 chance of beating opponents in their category. However, their odds of winning begin to lessen if they fight someone above their tier

Here is a visual example of a character ranked in this system. This character has a total of 35 points, placing him in the Super Normie Tier, which is populated by characters who display peak or trained human feats, often martial artists or particularly strong or skilled normal humans.

This was my first foray into spreadsheeting at this scale, which meant it was a great opportunity to learn a variety of things. My favorite feature I’ve learned of, which is the Freeze row, this feature, while simple, greatly improves my productivity as it allows me to keep track of categories easily
Here is a portion of the spreadsheet used to calculate these in ascending order of points. Do you recognize any characters?

Here is a graph showing the number of entries that were individually ranked. As mentioned before, over 500 characters were evaluated from over 50 franchises!
For reference, here are the 5 strongest characters in video game fiction according to this list
5.) Elizabeth - Persona 3
4.) Morrigan Aensland - Darkstalkers
3.) Megaman.EXE - MegaMan Battle Network
2.) Ragna The BloodEdge - Blazblue
1.) Kirby - Kirby

This idea first started off from many a strange idea, boredom during the pandemic.
I enjoy many crossover media and have always wondered what the legitimate victor in a battle between all the various crossover media would be I enjoy.
So, I asked myself the question you saw above and began collecting data.
I collected from all major crossover fighting games as well as guest characters from franchises, such as Soulcalibur and Tekken.